【Megatron-LM源码分析(三)】-性能分析

在算力利用率方面,Megatron-LM支持通过Pytorch Profiler和Nsys进行分析,注意这两者在Megatron-LM中是互斥的。

  • PyTorch Profiler:框架原生工具,更高层,侧重于 Python/PyTorch 算子层级,可以看到代码级的调用链,适合识别 Python 端的慢算子、内存泄漏、调度开销。

  • Nsys:系统级追踪工具,更底层,侧重于 CUDA 和硬件性能层级,适合分析 CUDA Kernel 执行、PCIe 带宽利用率、GPU 内存传输、多 GPU 通信(NCCL)等

在显存占用方面,Megatron-LM支持通过Pytorch自带的snapshot的功能来记录显存分配情况。

下面就如何开启这些分析方法以及示例做介绍。

PyTorch Profiler性能分析

使用方法

一般使用pytorch Profile的代码如下:

1
2
3
4
5
6
7
8
9
10
11
12
13
14
15
16
17
18
19
20
21
22
23
24
25
26
27
28
29
import torch
import torch.profiler
import os

logdir = "tb_profiler_test"

with torch.profiler.profile(
activities=[
torch.profiler.ProfilerActivity.CPU,
torch.profiler.ProfilerActivity.CUDA,
],
schedule=torch.profiler.schedule(
wait=1,
warmup=1,
active=2,
repeat=1,
),
on_trace_ready=torch.profiler.tensorboard_trace_handler(
logdir
),
record_shapes=True,
with_stack=True,
) as prof:
for step in range(6):
x = torch.randn(4096, 4096, device="cuda")
y = x @ x
torch.cuda.synchronize()
prof.step()

首先需要定义torch.profiler.schedule,然后通过prof.step来更新当前步数。最后的结果可以通过Tensboard或者Chrome的chrome://tracing/来查看。

相关代码

相关参数的介绍如下,

1
2
3
4
5
6
7
8
9
10
11
12
13
14
15
group.add_argument('--profile', action='store_true',
help='Enable nsys profiling. When using this option, nsys '
'options should be specified in commandline. An example '
'nsys commandline is `nsys profile -s none -t nvtx,cuda '
'-o <path/to/output_file> --force-overwrite true '
'--capture-range=cudaProfilerApi '
'--capture-range-end=stop`.')
group.add_argument('--profile-step-start', type=int, default=10,
help='Global step to start profiling.')
group.add_argument('--profile-step-end', type=int, default=12,
help='Global step to stop profiling.')
group.add_argument('--use-pytorch-profiler', action='store_true',
help='Use the built-in pytorch profiler. '
'Useful if you wish to view profiles in tensorboard.',
dest='use_pytorch_profiler')

megatron/training/training.pytraining函数中有如下的代码

1
2
3
4
5
6
7
8
9
10
11
12
13
14
15
16
17
18
19
20
21
22
23
24
25
26
27
28
    if (
args.profile
and torch.distributed.get_rank() in args.profile_ranks
and args.use_pytorch_profiler
):
prof = torch.profiler.profile(
schedule=torch.profiler.schedule(
wait=max(args.profile_step_start - 1, 0),
warmup=1 if args.profile_step_start > 0 else 0,
active=args.profile_step_end - args.profile_step_start,
repeat=1,
),
on_trace_ready=torch.profiler.tensorboard_trace_handler(args.tensorboard_dir),
record_shapes=True,
with_stack=True,
)
prof.start()

# ...

# Run training iterations till done.
while iteration < args.train_iters:
if args.profile and torch.distributed.get_rank() in args.profile_ranks:
if args.use_pytorch_profiler:
prof.step()
elif iteration == args.profile_step_start:
torch.cuda.cudart().cudaProfilerStart()
torch.autograd.profiler.emit_nvtx(record_shapes=True).__enter__()

这说明了只有开启profile、use_pytorch_profiler并且当前进程的rank在profile_ranks时才会开启prof。然后也在定义torch.profiler.profile时指明了需要跳过profile_step_start - 1步,然后只要profile_step_start>1就预热一轮否则不预热,然后采集args.profile_step_end - args.profile_step_start步。

在每次batch的迭代中会调用prof.step()来更新采集步数。

megatron/training/training.py中的post_training_step_callbacks有如下的代码负责在step达到profile_step_end后停止prof:

1
2
3
4
5
6
7
8
9
10
11
# Profiling.
if (
args.profile
and iteration == args.profile_step_end
and torch.distributed.get_rank() in args.profile_ranks
):
if args.use_pytorch_profiler:
assert prof is not None
prof.stop()
else:
torch.cuda.cudart().cudaProfilerStop()

注意这里说的step是指实际这一次训练运行了多少步,不与从checkpoint中恢复的当前的iter有关。

示例

运行脚本如下,关键是PROFILER_ARGS中添加的对应参数,其指示会采集110、111步。

1
2
3
4
5
6
7
8
9
10
11
12
13
14
15
16
17
18
19
20
21
22
23
24
25
26
27
28
29
30
31
32
33
34
35
36
37
38
39
40
41
42
43
44
45
46
47
48
49
50
51
52
53
54
55
56
57
58
59
60
61
62
63
64
65
66
67
68
69
70
71
72
73
74
75
76
77
78
79
80
81
82
83
84
85
86
87
88
89
90
91
92
93
94
95
96
97
98
99
100
101
102
103
104
105
106
107
108
109
110
111
112
113
114
115
116
117
118
#!/bin/bash

# Runs the "857m" parameter model

export CUDA_DEVICE_MAX_CONNECTIONS=1

GPUS_PER_NODE=4
# Change for multinode config
MASTER_ADDR=localhost
MASTER_PORT=6000
NUM_NODES=1
NODE_RANK=0
WORLD_SIZE=$(($GPUS_PER_NODE*$NUM_NODES))

CHECKPOINT_PATH=$1 #<Specify path>
TENSORBOARD_LOGS_PATH=$2 #<Specify path>
VOCAB_FILE=$3 #<Specify path to file>/gpt2-vocab.json
MERGE_FILE=$4 #<Specify path to file>/gpt2-merges.txt
DATA_PATH=$5 #<Specify path and file prefix>_text_document
USE_NSYS=0
if [[ ${6:-} == "--nsys" ]]; then
USE_NSYS=1
fi

DISTRIBUTED_ARGS=(
--nproc_per_node $GPUS_PER_NODE
--nnodes $NUM_NODES
--master_addr $MASTER_ADDR
--master_port $MASTER_PORT
)

GPT_MODEL_ARGS=(
--num-layers 24
--hidden-size 1024
--num-attention-heads 16
--seq-length 2048
--max-position-embeddings 2048
--attention-backend auto # Can use (flash/fused/unfused/local)
)

TRAINING_ARGS=(
--micro-batch-size 4
--global-batch-size 16
# --rampup-batch-size 16 16 5859375
--train-iters 20000
--weight-decay 0.1
--adam-beta1 0.9
--adam-beta2 0.95
--init-method-std 0.006
--clip-grad 1.0
--fp16
--lr 6.0e-5
--lr-decay-style cosine
--min-lr 6.0e-6
--lr-warmup-fraction .001
--lr-decay-iters 20000
)

MODEL_PARALLEL_ARGS=(
--tensor-model-parallel-size 1
--pipeline-model-parallel-size 1
)

DATA_ARGS=(
--data-path $DATA_PATH
--vocab-file $VOCAB_FILE
--merge-file $MERGE_FILE
--split 949,50,1
)

EVAL_AND_LOGGING_ARGS=(
--log-interval 200
--save-interval 10000
--eval-interval 1000
--save $CHECKPOINT_PATH
--load $CHECKPOINT_PATH
--eval-iters 10
--tensorboard-dir $TENSORBOARD_LOGS_PATH
)

PROFILER_ARGS=(
--profile
--use-pytorch-profiler
--profile-step-start 110
--profile-step-end 112
--profile-ranks 0
)

# Build command as an array (no string concatenation)
CMD=(
torchrun
"${DISTRIBUTED_ARGS[@]}"
pretrain_gpt.py
"${GPT_MODEL_ARGS[@]}"
"${TRAINING_ARGS[@]}"
"${MODEL_PARALLEL_ARGS[@]}"
"${DATA_ARGS[@]}"
"${EVAL_AND_LOGGING_ARGS[@]}"
"${PROFILER_ARGS[@]}"
)

if [[ "$USE_NSYS" -eq 1 ]]; then
NSIGHT_PREFIX="./nsight_profile/gpt3_857m"
echo "Running with Nsight profiling, output prefix: ${NSIGHT_PREFIX}"
exec nsys profile \
-s none -t nvtx,cuda \
--cudabacktrace=all \
--cuda-graph-trace=node \
--python-backtrace=cuda \
--wait all \
-o "${NSIGHT_PREFIX}" \
--force-overwrite true \
--capture-range=cudaProfilerApi \
--capture-range-end=stop \
"${CMD[@]}"
else
exec "${CMD[@]}"
fi

运行的指令如下:

1
bash examples/gpt3/train_gpt3_857m_distributed.sh     /workspace/megatron-lm/model_ckpt/gpt3_857m_2     /workspace/megatron-lm/tb_logs/gpt3_857m_profiler     /workspace/megatron-lm/data/tokenizer/gpt2-vocab.json     /workspace/megatron-lm/data/tokenizer/gpt2-merges.txt     /workspace/megatron-lm/data/TinyStoriesV2-GPT4-train_text_document      > gpt3_857m2.log 2>&1 &

运行后会在tensorboard-dir下获取对应的pt.trace.json文件,例如本次运行获得的是tb_logs/gpt3_857m_profiler/6dacc15685cd_821091.1766741105666343018.pt.trace.json文件

可以用tensor board或者是Chrome查看该文件,如下是访问Chrome的chrome://tracing/查看的结果:

CPU层面的Python代码分析的结果如下,可以看到整个调用链还是很清楚的:

GPU层面的分析结果如下,由于这里使用的是简单的数据并行,所以每一步后都有一次all reduce进行参数收集,整体逻辑看的还是很清楚的。

Nsys性能分析

使用方法

一般使用Nsys的代码如下,其中range_push(“xxx”)与range_pop()为一段运行的代码区间标注了区间名

1
2
3
4
5
6
7
8
9
10
11
12
13
14
15
16
17
18
19
20
21
22
23
import torch
import torch.cuda.nvtx as nvtx
import time

device = "cuda"

# warmup
for _ in range(2):
x = torch.randn(4096, 4096, device=device)
y = x @ x
torch.cuda.synchronize()

# profile 区间
nvtx.range_push("matmul_step")

x = torch.randn(4096, 4096, device=device)
y = x @ x
torch.cuda.synchronize()

nvtx.range_pop()

time.sleep(0.2) # 让 CPU timeline 更明显

需要用如下的nsys开头的命令运行:

1
2
3
4
nsys profile \
--trace=cuda,nvtx,osrt \
-o simple_matmul \
python example.py

运行后会生成simple_matmul.nsys-rep,然后可以下载Nsight Systems对其进行查看。

相关代码

相关参数的介绍其实与Pytorch Profiler类似,不同之处需要关闭use_pytorch_profiler。

Megatron-LM也在多个地方专门手动标注了profile 区间以便于查看。

整体与Pytorch Profile类似,其通过step步数来控制达到args.profile_step_start步数时才开启profile,

1
2
3
4
5
6
7
8
# Run training iterations till done.
while iteration < args.train_iters:
if args.profile and torch.distributed.get_rank() in args.profile_ranks:
if args.use_pytorch_profiler:
prof.step()
elif iteration == args.profile_step_start:
torch.cuda.cudart().cudaProfilerStart()
torch.autograd.profiler.emit_nvtx(record_shapes=True).__enter__()

然后当步数达到args.profile_step_end步数时才关闭profile

1
2
3
4
5
6
7
8
9
10
11
# Profiling.
if (
args.profile
and iteration == args.profile_step_end
and torch.distributed.get_rank() in args.profile_ranks
):
if args.use_pytorch_profiler:
assert prof is not None
prof.stop()
else:
torch.cuda.cudart().cudaProfilerStop()

示例

运行的脚本如下,注意这里相比Pytorch Profile删掉了--use-pytorch-profiler

1
2
3
4
5
6
7
8
9
10
11
12
13
14
15
16
17
18
19
20
21
22
23
24
25
26
27
28
29
30
31
32
33
34
35
36
37
38
39
40
41
42
43
44
45
46
47
48
49
50
51
52
53
54
55
56
57
58
59
60
61
62
63
64
65
66
67
68
69
70
71
72
73
74
75
76
77
78
79
80
81
82
83
84
85
86
87
88
89
90
91
92
93
94
95
96
97
98
99
100
101
102
103
104
105
106
107
108
109
110
111
112
113
114
115
116
117
#!/bin/bash

# Runs the "857m" parameter model

export CUDA_DEVICE_MAX_CONNECTIONS=1

GPUS_PER_NODE=4
# Change for multinode config
MASTER_ADDR=localhost
MASTER_PORT=6000
NUM_NODES=1
NODE_RANK=0
WORLD_SIZE=$(($GPUS_PER_NODE*$NUM_NODES))

CHECKPOINT_PATH=$1 #<Specify path>
TENSORBOARD_LOGS_PATH=$2 #<Specify path>
VOCAB_FILE=$3 #<Specify path to file>/gpt2-vocab.json
MERGE_FILE=$4 #<Specify path to file>/gpt2-merges.txt
DATA_PATH=$5 #<Specify path and file prefix>_text_document
USE_NSYS=0
if [[ ${6:-} == "--nsys" ]]; then
USE_NSYS=1
fi

DISTRIBUTED_ARGS=(
--nproc_per_node $GPUS_PER_NODE
--nnodes $NUM_NODES
--master_addr $MASTER_ADDR
--master_port $MASTER_PORT
)

GPT_MODEL_ARGS=(
--num-layers 24
--hidden-size 1024
--num-attention-heads 16
--seq-length 2048
--max-position-embeddings 2048
--attention-backend auto # Can use (flash/fused/unfused/local)
)

TRAINING_ARGS=(
--micro-batch-size 4
--global-batch-size 16
# --rampup-batch-size 16 16 5859375
--train-iters 20000
--weight-decay 0.1
--adam-beta1 0.9
--adam-beta2 0.95
--init-method-std 0.006
--clip-grad 1.0
--fp16
--lr 6.0e-5
--lr-decay-style cosine
--min-lr 6.0e-6
--lr-warmup-fraction .001
--lr-decay-iters 20000
)

MODEL_PARALLEL_ARGS=(
--tensor-model-parallel-size 1
--pipeline-model-parallel-size 1
)

DATA_ARGS=(
--data-path $DATA_PATH
--vocab-file $VOCAB_FILE
--merge-file $MERGE_FILE
--split 949,50,1
)

EVAL_AND_LOGGING_ARGS=(
--log-interval 200
--save-interval 10000
--eval-interval 1000
--save $CHECKPOINT_PATH
--load $CHECKPOINT_PATH
--eval-iters 10
--tensorboard-dir $TENSORBOARD_LOGS_PATH
)

PROFILER_ARGS=(
--profile
--profile-step-start 110
--profile-step-end 112
--profile-ranks 0
)

# Build command as an array (no string concatenation)
CMD=(
torchrun
"${DISTRIBUTED_ARGS[@]}"
pretrain_gpt.py
"${GPT_MODEL_ARGS[@]}"
"${TRAINING_ARGS[@]}"
"${MODEL_PARALLEL_ARGS[@]}"
"${DATA_ARGS[@]}"
"${EVAL_AND_LOGGING_ARGS[@]}"
"${PROFILER_ARGS[@]}"
)

if [[ "$USE_NSYS" -eq 1 ]]; then
NSIGHT_PREFIX="./nsight_profile/gpt3_857m"
echo "Running with Nsight profiling, output prefix: ${NSIGHT_PREFIX}"
exec nsys profile \
-s none -t nvtx,cuda \
--cudabacktrace=all \
--cuda-graph-trace=node \
--python-backtrace=cuda \
--wait all \
-o "${NSIGHT_PREFIX}" \
--force-overwrite true \
--capture-range=cudaProfilerApi \
--capture-range-end=stop \
"${CMD[@]}"
else
exec "${CMD[@]}"
fi

运行的指令如下,注意这里添加了--nsys来在脚本中用nsys启动:

1
bash examples/gpt3/train_gpt3_857m_distributed.sh     /workspace/megatron-lm/model_ckpt/gpt3_857m_2     /workspace/megatron-lm/tb_logs/gpt3_857m_profiler     /workspace/megatron-lm/data/tokenizer/gpt2-vocab.json     /workspace/megatron-lm/data/tokenizer/gpt2-merges.txt     /workspace/megatron-lm/data/TinyStoriesV2-GPT4-train_text_document     --nsys      > gpt3_857m2.log 2>&1 &

最后会得到nsight_profile/gpt3_857m.nsys-rep,将其放入Nsight Systems中查看结果如下:

确实看下来是更底层了些,cuda相关的分析更加全面了。

Memory Snap显存分析

使用方法

Pytorch的Memory snap的整体使用方法如下:

1
2
3
4
torch.cuda.memory._record_memory_history()               # 开始记录
run_your_code() # 训练或推理代码
torch.cuda.memory._dump_snapshot("my_snapshot.pickle") # 保存文件
torch.cuda.memory._record_memory_history(enabled=None) # 终止记录

运行后得到my_snapshot.pickle,然后可以到https://docs.pytorch.org/memory\_viz中进行查看。

相关代码

其相关参数的介绍如下,有--record-memory-history--memory-snapshot-path两个

1
2
3
4
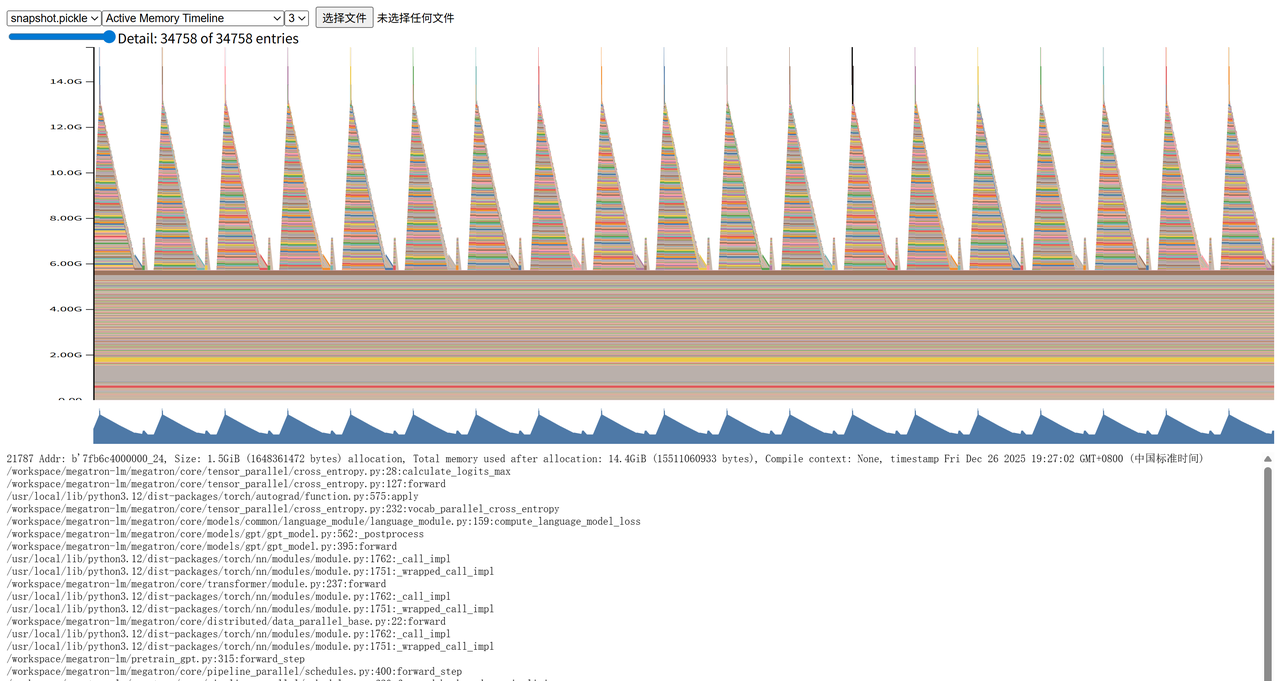
group.add_argument('--record-memory-history', action="store_true", default=False,
help='Record memory history in last rank.')
group.add_argument('--memory-snapshot-path', type=str, default="snapshot.pickle",
help='Specifies where to dump the memory history pickle.')

pretrain_gpt.py中的model_provider函数中,有如下代码:

1
2
3
4
5
6
7
8
9
10
11
12
13
14
15
16
17
18
19
20
21
if args.record_memory_history:
torch.cuda.memory._record_memory_history(
True,
# keep 100,000 alloc/free events from before the snapshot
trace_alloc_max_entries=100000,
# record stack information for the trace events
trace_alloc_record_context=True,
)

def oom_observer(device, alloc, device_alloc, device_free):
# snapshot right after an OOM happened
print('saving allocated state during OOM')
snapshot = torch.cuda.memory._snapshot()
from pickle import dump

dump(
snapshot,
open(f"oom_rank-{torch.distributed.get_rank()}_{args.memory_snapshot_path}", 'wb'),
)

torch._C._cuda_attach_out_of_memory_observer(oom_observer)

可以看到启动snap的条件是配置上--record-memory-history(对应 args.record_memory_history=True),然后snap的配置也写的比较死,就是直接写定最多保留 10 万条 alloc/free 事件,并为每条 alloc/free 记录调用栈/上下文信息。然后这里还定义了一个oom_observer,主要作用是在oom的时候调用该函数,然后将当前显存调用情况保存下来。

然后在megatron/training/training.pytraining_log函数中,存在如下的代码:

1
2
3
4
5
6
7
if iteration % args.log_interval == 0:
if args.record_memory_history and is_last_rank():
snapshot = torch.cuda.memory._snapshot()
from pickle import dump

with open(args.memory_snapshot_path, 'wb') as f:
dump(snapshot, f)

即如果当前迭代次数是log_interval的整数倍,并且标记了要记录Memory情况并且是最后一个rank,那么就将当前的snapshot保存下来。

示例

运行的脚本如下,关键是在PROFILER_ARGS参数中添加了--record-memory-history以及--memory-snapshot-path './snapshot/snapshot.pickle'

1
2
3
4
5
6
7
8
9
10
11
12
13
14
15
16
17
18
19
20
21
22
23
24
25
26
27
28
29
30
31
32
33
34
35
36
37
38
39
40
41
42
43
44
45
46
47
48
49
50
51
52
53
54
55
56
57
58
59
60
61
62
63
64
65
66
67
68
69
70
71
72
73
74
75
76
77
78
79
80
81
82
83
84
85
86
87
88
89
90
91
92
93
94
95
96
97
98
99
100
101
102
103
104
105
106
107
108
109
110
111
112
113
114
115
116
117
118
#!/bin/bash

# Runs the "857m" parameter model

export CUDA_DEVICE_MAX_CONNECTIONS=1

GPUS_PER_NODE=4
# Change for multinode config
MASTER_ADDR=localhost
MASTER_PORT=6000
NUM_NODES=1
NODE_RANK=0
WORLD_SIZE=$(($GPUS_PER_NODE*$NUM_NODES))

CHECKPOINT_PATH=$1 #<Specify path>
TENSORBOARD_LOGS_PATH=$2 #<Specify path>
VOCAB_FILE=$3 #<Specify path to file>/gpt2-vocab.json
MERGE_FILE=$4 #<Specify path to file>/gpt2-merges.txt
DATA_PATH=$5 #<Specify path and file prefix>_text_document
USE_NSYS=0
if [[ ${6:-} == "--nsys" ]]; then
USE_NSYS=1
fi

DISTRIBUTED_ARGS=(
--nproc_per_node $GPUS_PER_NODE
--nnodes $NUM_NODES
--master_addr $MASTER_ADDR
--master_port $MASTER_PORT
)

GPT_MODEL_ARGS=(
--num-layers 24
--hidden-size 1024
--num-attention-heads 16
--seq-length 2048
--max-position-embeddings 2048
--attention-backend auto # Can use (flash/fused/unfused/local)
)

TRAINING_ARGS=(
--micro-batch-size 4
--global-batch-size 16
# --rampup-batch-size 16 16 5859375
--train-iters 20000
--weight-decay 0.1
--adam-beta1 0.9
--adam-beta2 0.95
--init-method-std 0.006
--clip-grad 1.0
--fp16
--lr 6.0e-5
--lr-decay-style cosine
--min-lr 6.0e-6
--lr-warmup-fraction .001
--lr-decay-iters 20000
)

MODEL_PARALLEL_ARGS=(
--tensor-model-parallel-size 1
--pipeline-model-parallel-size 1
)

DATA_ARGS=(
--data-path $DATA_PATH
--vocab-file $VOCAB_FILE
--merge-file $MERGE_FILE
--split 949,50,1
)

EVAL_AND_LOGGING_ARGS=(
--log-interval 200
--save-interval 10000
--eval-interval 1000
--save $CHECKPOINT_PATH
--load $CHECKPOINT_PATH
--eval-iters 10
--tensorboard-dir $TENSORBOARD_LOGS_PATH
)

PROFILER_ARGS=(
--profile
--record-memory-history
--profile-step-start 110
--profile-step-end 112
--profile-ranks 0
)

# Build command as an array (no string concatenation)
CMD=(
torchrun
"${DISTRIBUTED_ARGS[@]}"
pretrain_gpt.py
"${GPT_MODEL_ARGS[@]}"
"${TRAINING_ARGS[@]}"
"${MODEL_PARALLEL_ARGS[@]}"
"${DATA_ARGS[@]}"
"${EVAL_AND_LOGGING_ARGS[@]}"
"${PROFILER_ARGS[@]}"
)

if [[ "$USE_NSYS" -eq 1 ]]; then
NSIGHT_PREFIX="./nsight_profile/gpt3_857m"
echo "Running with Nsight profiling, output prefix: ${NSIGHT_PREFIX}"
exec nsys profile \
-s none -t nvtx,cuda \
--cudabacktrace=all \
--cuda-graph-trace=node \
--python-backtrace=cuda \
--wait all \
-o "${NSIGHT_PREFIX}" \
--force-overwrite true \
--capture-range=cudaProfilerApi \
--capture-range-end=stop \
"${CMD[@]}"
else
exec "${CMD[@]}"
fi

运行指令为:

1
bash examples/gpt3/train_gpt3_857m_distributed.sh     /workspace/megatron-lm/model_ckpt/gpt3_857m_2     /workspace/megatron-lm/tb_logs/gpt3_857m_profiler     /workspace/megatron-lm/data/tokenizer/gpt2-vocab.json     /workspace/megatron-lm/data/tokenizer/gpt2-merges.txt     /workspace/megatron-lm/data/TinyStoriesV2-GPT4-train_text_document      > gpt3_857m2.log 2>&1 &

运行后会得到snapshot/snapshot.pickle,将其放入到https://docs.pytorch.org/memory\_viz中进行查看,结果如下:

其最底层的就是基础的模型、优化器的显存占用,上面的动态激活显存可以看到呈现明显的周期性,其显存占用最高的时候就是通过cross_entropy计算loss的时候,可以达到约15GB。这是因为这时前向传播的激活全部都计算完毕,后续反向传播的时候激活依次释放。


【Megatron-LM源码分析(三)】-性能分析
http://example.com/2025/12/26/megatron-lm-profiler/
作者
滑滑蛋
发布于
2025年12月26日
许可协议